When you go online looking to expand your site’s reach and subsequently the traffic that comes through, one of the first things that will undoubtedly pop up will be SEO, more specifically the SEO rating. Without getting into too much technical detail, an SEO (Search Engine Optimization) rating is one of the main factors search engine algorithms use when bringing up results to searchers. Most importantly, it’s a significant factor in Google algorithms, and you all want that coveted first-page spot (without paid marketing campaigns).
You can follow simple rules to make every post, page, or video score higher by adapting a few tags, words, and phrases. However, the most important thing to take into account is keywords.
Change in Paradigm
It’s been a while since the main form of navigating the web was to input the website URL directly. Instead, we’ve all shifted to search engines (by far most prominently Google) to get where we want to go while having a few regularly visited sites saved for quick access. Because of this shift, keywords and phrases have become more important than ever. Essentially you aren’t even looking for sites anymore, and you’re looking for pages that feature precisely what you’re looking for.

Let’s say you want to buy a new football. You’ll type in something like “football prices” or “Wilson football” – you don’t want to get to the main page of a sporting goods store and have to navigate to the balls sections, then filter even further just to get to the footballs. With time in such short supply, the customer wants to access that final, filtered page with exactly one click after the search has yielded the results; no time to waste. Considering all of that, you can see why keywords are important to feature and emphasize on every page, product page, post, multimedia content, etc.
Find the Right Words
Knowing you have to use keywords is entirely different from knowing which keywords to use. Much like everything else, some will perform better than others, so it’s important to zero in on those keywords that will make a difference. Since keywords are so important, the market for SEO tools is saturated with all kinds of apps and services that will help you pinpoint everything you need to maximize your potential. Faced with too many options could mean indecisiveness and ultimately lead to paying for an inadequate service simply because you weren’t prepared enough.
Seeing as how Google is the gateway to most of the content on the web, there’s no reason to stray from services they provide directly (either individually or as part of a bigger package deal).
As the theme of the day is keywords, we’re going to dive deeper into Google Trends – how to use it and how the data you gain can be interpreted and implemented.
Familiar Searching
The main page you’re presented with when you go to Google Trends resembles the default page you access when you go to the search engines page. We wouldn’t say it’s standardized to the point of being identical, but there’s a familiar feel to it, and because it’s so recognizable, you’ll be more inclined to use it.
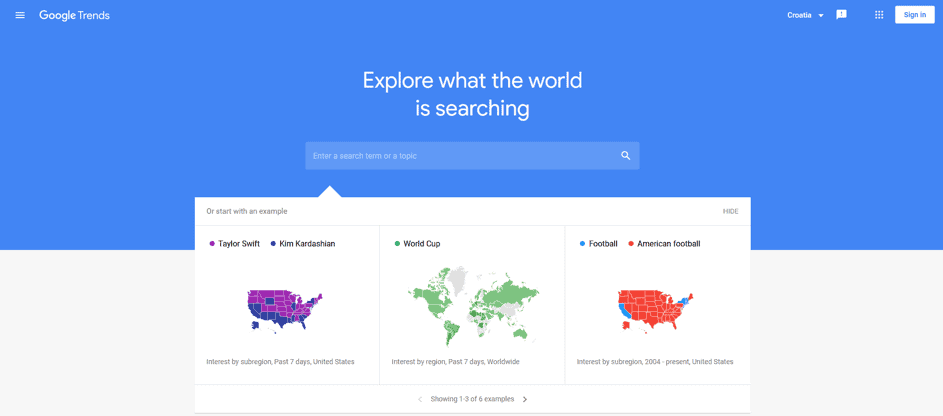
If the idea was to go for a simple UI, we have to say they’ve nailed it. The starting interface couldn’t be more straightforward. The search bar front and center enable you to go instantly, accompanied by a couple of trending suggestions you might find interesting to dissect. The suggestions you’re presented with come with an image of regional or worldwide search trends, meaning you can see, at a glance, how well and where a popular keyword is performing through a specific period.
If you don’t need the suggestions, ignore them and do your thing. Again, as you would with the standard search engine, type in a keyword or phrase you wish to inspect, choose the nation you want to get the data for (this can be changed on the next screen), and that’s it; really can’t be any simpler.
Getting the Results
Once you’ve entered your keyword or phrase, we get the results. These are divided into sections that provide you with specific insight into searches containing your desired keyword or phrase. Before going into them, however, you can choose from a couple of filters on how you want your data represented. For our example, we’ve used “limited edition sneakers”, so let’s say we’re representing an up-and-coming webshop specializing in sneakers that came out in limited editions or are older and therefore rare.
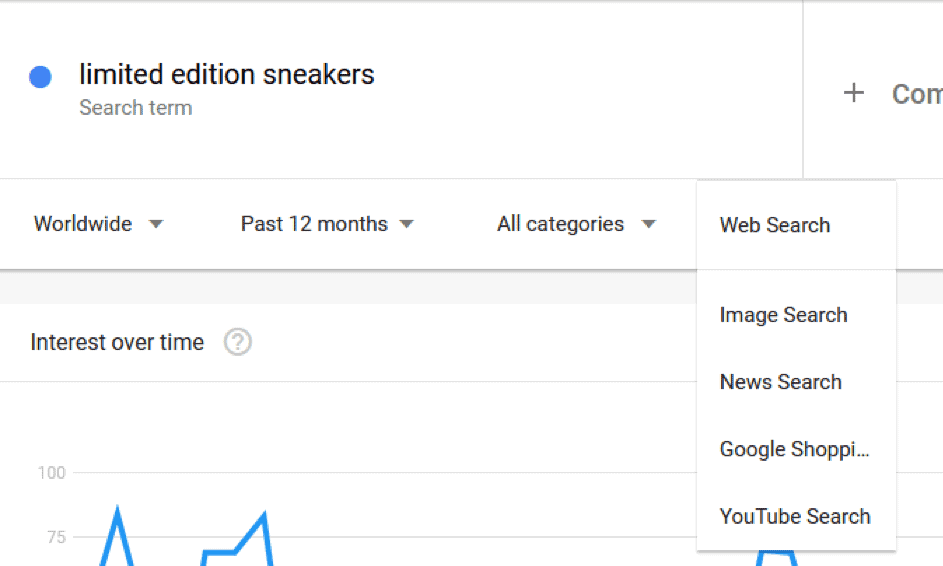
The filters that we get to use are:
- Country – you can single out any country for Google Trends to get you data just for them, ignoring all the rest. If you’re planning to sell solely in the US, there is no need to cloud your data with additional information.
- Time frame – how long do you want to pull data from. Depending on what you need, you can go for data within the last hour to data from 2004. onward and everything in between. With the ever-shifting nature of trends in general, it’s advisable to use only relevant data and leave the past where it belongs.
- Category – pretty self-explanatory. You can choose from categories to single out, such as new, science, games, shopping, etc. Keep in mind that these categories are the default ones Google uses. You can make custom categories.
- Type of search – since Google encompasses various kinds of searches in addition to their “regular” homepage, everyone is so accustomed to. For example, if you’re running a multimedia site, you’ll want to check searches pertaining only to images or YouTube bypassing web searches entirely.
With your filters all set, it’s time to look at the data Google Trends has gathered for you. The first thing you get to see is the keyword/phrase interest over time. This is directly linked to the time frame filter you’ve just set.
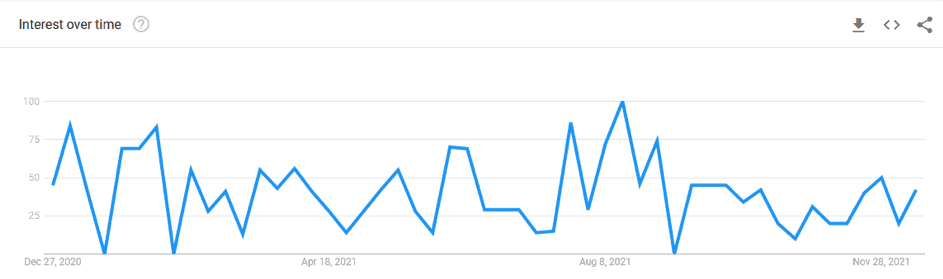
The numbers shown are self-contained to the desired term, meaning 100 is peak popularity, and zero is the lowest popularity, but the only context of the keyword/phrase itself, not compared to other queries. An interest graph like this can indicate not only how a keyword has performed, but where it can potentially go. Ideally, you’d want to get on board just as the uptick in popularity is beginning to happen to maximize the longer peak. On the other hand, if you land on the peak and/or downswing, the numbers will surely reflect the negative trend.
Now that you know how your query has performed over time let’s see how it has performed based on location. Looking at the map of interest by region (even though it labels it as “region”, it’s countries), you can get information on your target audience or maybe even alter your priorities. You emphasize selling in the UK, but France has a much bigger interest rate. Why not add French localization to your site, taking advantage of the situation.
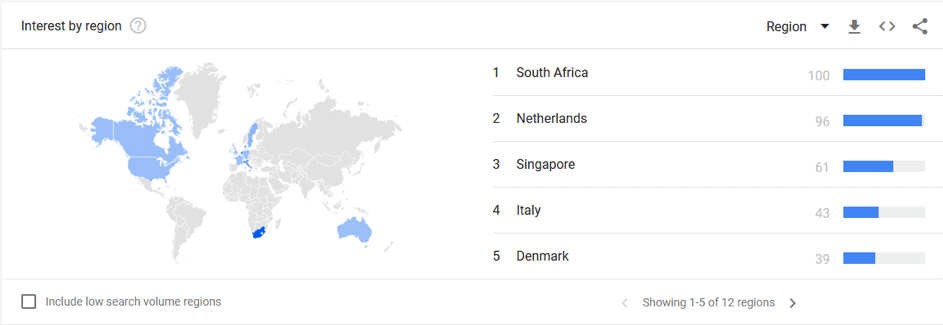
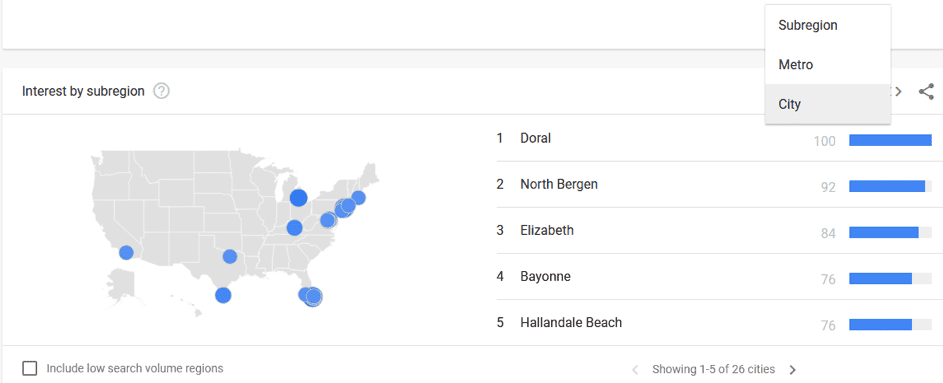
It’s worth pointing out that the more popular the keyword/phrase you’re looking for, the more data will be available. Lesser searched words will only have a worldwide map available for popular ones. On the other hand, you can go into subregions (like states in the US) and even metro areas and cities. There aren’t many situations when you’ll want to get into so much detail, but it in no way hurts to have the option available.
Everything Is Related
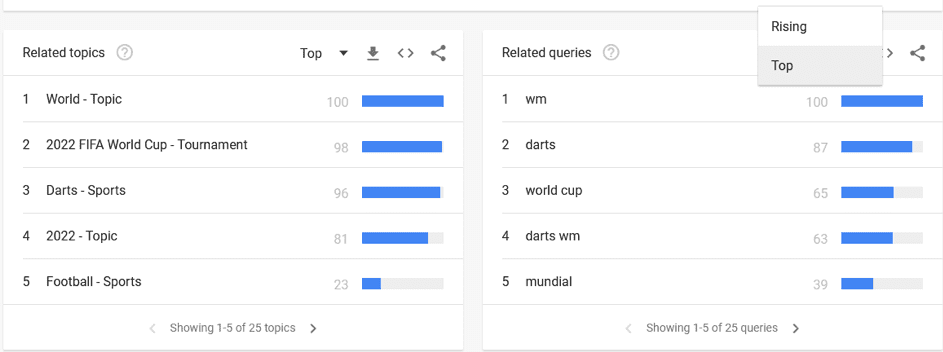
When searching for something specific, it always helps to consider similar topics and queries, if nothing else, to get a perspective and maybe an idea of the direction you could branch out from your original idea. It’s important to note that both sections feature keywords/phrases in their original form, so if you choose to get worldwide data (in our example for “World cup”) you’ll get the most popular results regardless of language as you can see in the table below.
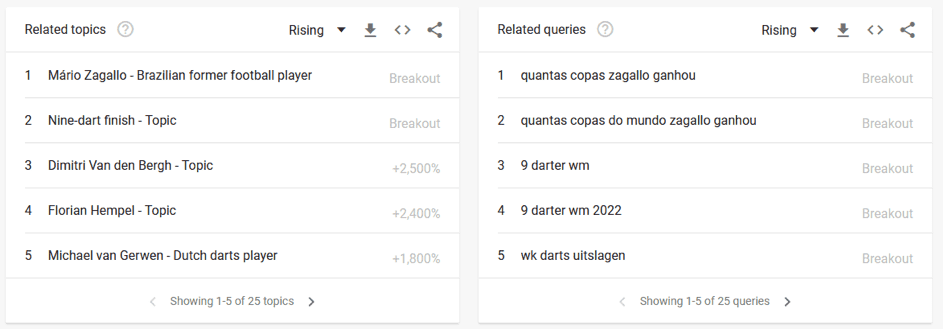
In this section, results can be shown in two distinct ways – rising and top. The “rising” sorting shows topics and queries with the most uptick in popularity over your selected time frame, whereas “top” sorting shows those that have the absolute most queries in total. Think of the former as “trending” and the latter as “best all-time” selections, and you’ll have a good idea of what each represents.
Comparison
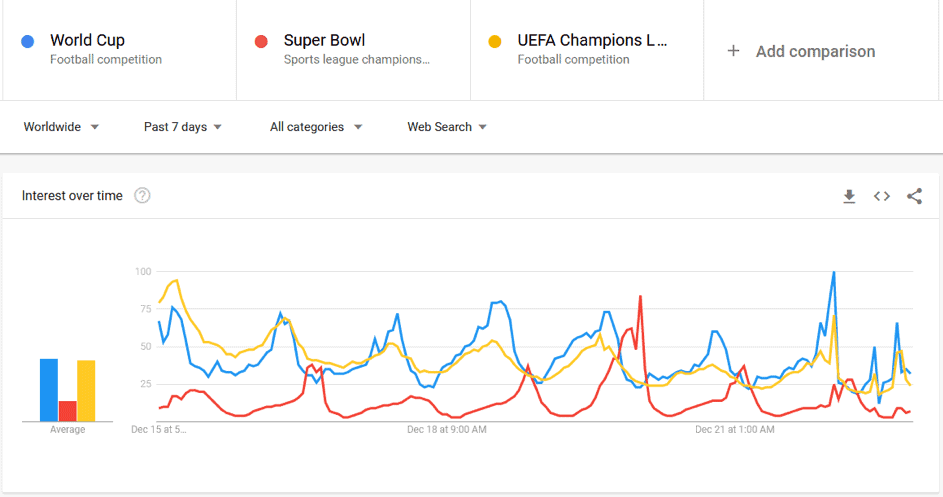
Finally, you’ll have the option to combine and compare two or more keywords/phrases if you’re in a dilemma on which ones to use. Every bit of data we’ve already covered is present here as well, with every graph, map, and related query. The only difference is that now you have more of them on the same page – one for every term you’ve entered with the “interest over time” graph showing all of them in the same table to get the most accurate idea of how they stand up against each other.
Summary
With keywords/phrases, there shouldn’t be much beating around the bush. It would be best if you were direct and to the point. You need to invest time into researching which ones to use that fit your particular brand, and on top of that, find what variations could work to put your SEO score even more over the top. Forcefully using the ones that simply aren’t trending is the road to ruin.
When we know that Google is the alpha and omega on just about everything an average user does on the web, it’s only fitting you should use their instruments to make sure your page grade higher on their search engine. Google Trends is the future of analytics, at least where keywords/phrases are concerned and you don’t want to be left behind.