Developers often underestimate the time it takes to debug something (this, unfortunately, includes me). Consequently, we are too lazy (and proud) to get a proper debugging environment going because, well, it’s a simple problem and will only take “a few minutes” to fix. This is where console.log() in JavaScript or var_dump(); die; in PHP come into play (I have a few tricks for that too). It might be dirty debugging, but it’s something everyone does. Years of experience in the deepest coding trenches have thought me a few tricks with console that save serious amounts of time & nerves. These lazy tricks can be particularly helpful for JavaScript developers seeking to streamline their debugging process and enhance the efficiency of their code.
You should always set up a proper debugging environment so you can trace through code like a civilized person. Get off your high horse! Yes, in a perfect world that would be true, but we don’t live in a perfect world. I’m 100% sure that everyone who codes for a living uses console.log so why not use it more efficiently?
I never use console.log
Wait, what!? console.log() doesn’t tell you the whole story. You only get the line number where log() is placed but not the whole trace of how it was called, via what function(s). So if you have more than a few calls to the same function, there’s no way you can know what’s going on without adding some explicit messages like “this was called in foo() from bar().” That’s why I always use console.trace(). Besides doing the same thing as log() (outputting whatever you pass on as arguments), it also outputs the stack trace, so you know on which line you put the trace() call on and also what function or functions called it. It’s an unbelievable improvement over log().
function foo( size ) {
  function bar( size ) {
    console.trace( size + ' (from trace)' );
    console.log( size + ' (from log)' );
  }
  bar( size + 1 );
}

foo( 6 );

Read the trace from the bottom. From an anonymous function on line #9 we called foo() then we called bar() from line #6 and got to trace() on line #3. log() on the other hand shows only its position in the file on line #4.
Stop variable name confusion
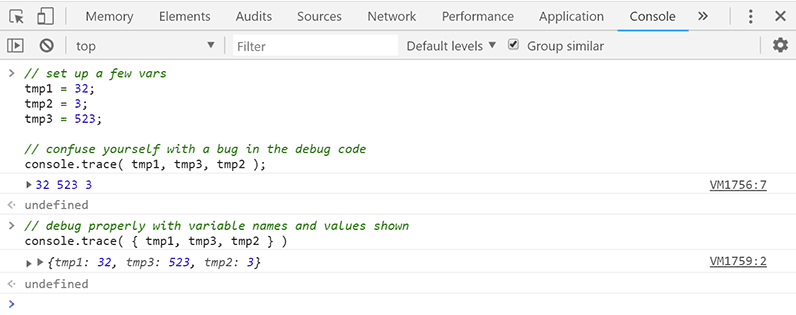
Since I’m lazy, it’s entirely possible that I’d name three variables tmp1, tmp2, and tmp3. And let’s assume all three have integer values. So then I debug them with console.trace(tmp1, tmp3, tmp2) and manage to put a bug in my debugging code. See it? I messed up the order. Now it will take me ten minutes to figure out why the values are not good just because I don’t know which variable is which.
By using a thing called computed property names, I can remain lazy because besides variable values their names will be printed as well, removing the need to know (or guess) the order. Instead of adding three params to trace() I add one and create an object – console.trace( { tmp1, tmp3, tmp2 } ). It’s that simple!

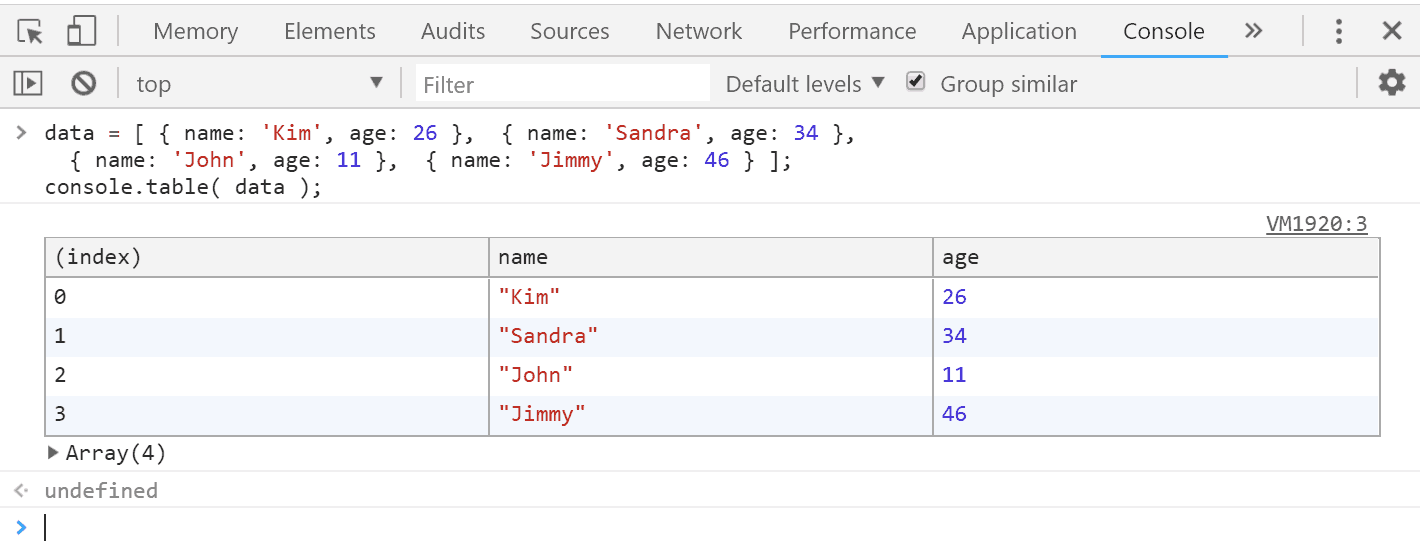
If you have a larger array or object use console.table(). It’ll produce a far more readable output in the form of a table. Especially handy for debugging DB results passed on via JSON.

Speed is everything
Chrome has so many debugging and performance oriented tools built into the console that anything extra is just not needed in 9/10 situations. For those who are overwhelmed console.time( timer_label ) and console.timeEnd( timer_label ) will come in handy. Start a named timer; do something; end named timer and display elapsed time. Naming a timer is optional but a good practice to get used to because if you have more than one timer, it’s easy to forget to name them and then they all use “default” and the result is not what you expect.

console.memory also comes in handy when you want a quick look at the used heap sizes. Remember – it’s a variable! Not a function like other things we looked at so far.
When you’re too lazy to do an if()
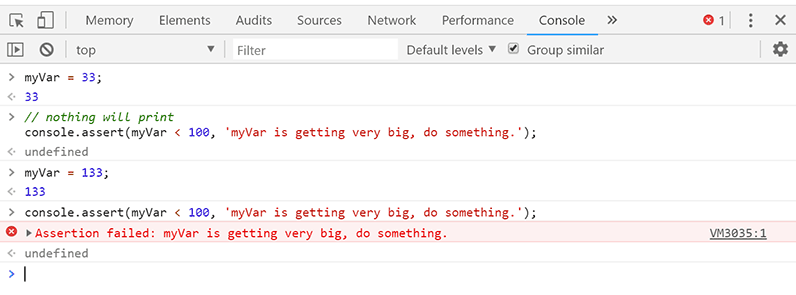
I’m all for writing less code but when using tricks such as this readability becomes quite questionable. Outputting a message only when certain conditions are met is a common scenario. Instead of writing a regular if() you can do console.assert(myVar < 100, 'myVar is getting very big, do something.') and the message will print only when myVar is bigger or equal to 100. You should look at any assert command as if “I’m assuming the var is what I wrote, do something if it’s not”; in our case, we assume it’s less than a 100. Fancy, right?

A few closing tricks
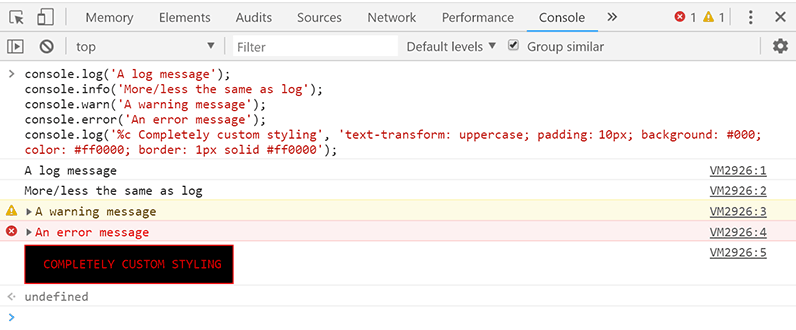
If needed messages can be colored (and categorized) by using console.warn() which gives an orange-ish message and console.error() which outputs a red-ish one. If you want to go custom all the way there’s the %c directive. It works in all functions like this: console.log('%c my message', 'color:red; background-color: black;'). The second param is a valid piece of CSS. What various browsers allow in terms of styling may vary.

Implementations of the Console object vary from browser to browser. From what I’ve seen the differences are negligible. Functions that are used the most work the same in all browsers, and don’t need a coding test. My browser of choice is Chrome, so I’ll point you to its Console API Reference. For a more generic document have a look at Mozilla’s docs. Happy dirty debugging 😉