Testing a website or web application and its user interface can be tricky and time-consuming, especially if you are not using appropriate debugging tools such as the Chrome console, also known as Chrome developer tools.
Almost all web browsers now have support for developer tools, but Google seems to be more determined in providing the best environment for a speedy debugging process.
Google has really worked hard to make Chrome DevTools as developer-friendly as possible. So much so that the question is no longer what you can do using these developer tools built directly into Google Chrome browser. It’s now a matter of how much you know about the chrome console.
Although mostly used by developers, Chrome’s console is an exceptionally useful tool for anyone who wants to peek “under the hood” of any website. Not only will it help you understand how things work, but it can also help you identify suspicious behavior on any site.
There are specific Chrome console features that tend to fascinate every developer. Some believe it’s the best developer tool for looking up how part of a website is made, including scripts and styling. Other developers find it more useful in tracking link tags, browser rendering, HTTP requests & responses, page breaking points, testing new features or scripts, etc.
This article will barely scratch the surface of what can be done with the Console. For a complete overview of features and the manual head over to the official Google Developer page.
How to open the Chrome console
The conventional means of accessing the Chrome DevTools is to click on the Customize and Control Google Chrome button (the three vertical dots at the top right corner of the Chrome browser menu bar), scroll down to more tools and select the developer tools.
Keyboard shortcut: Ctrl + Shift + I for Windows and Cmd + Options + I for Macintosh.
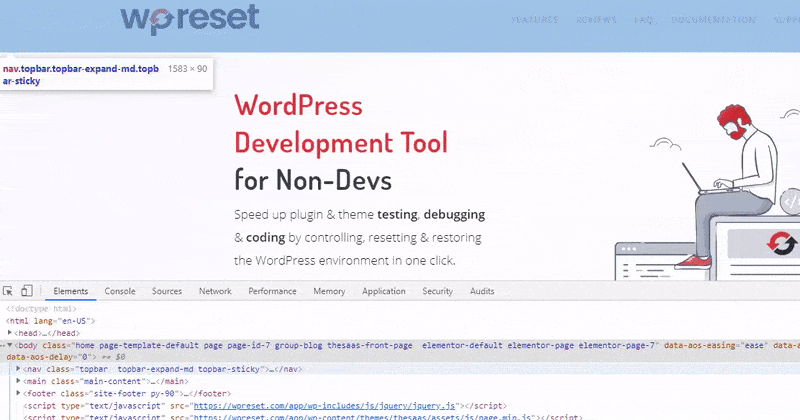
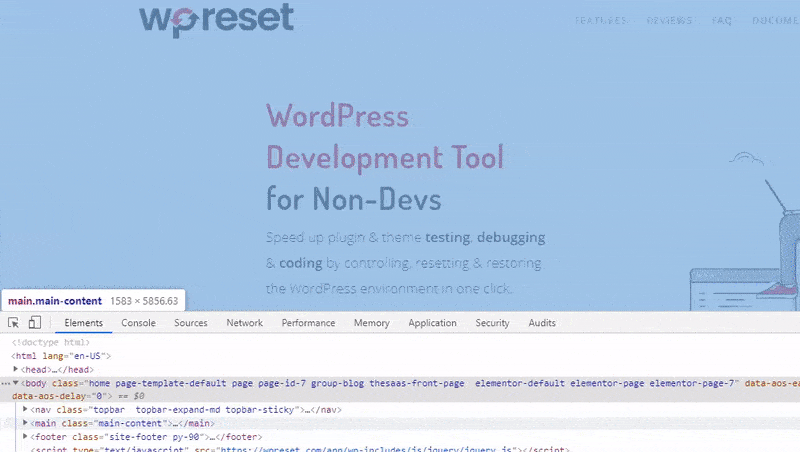
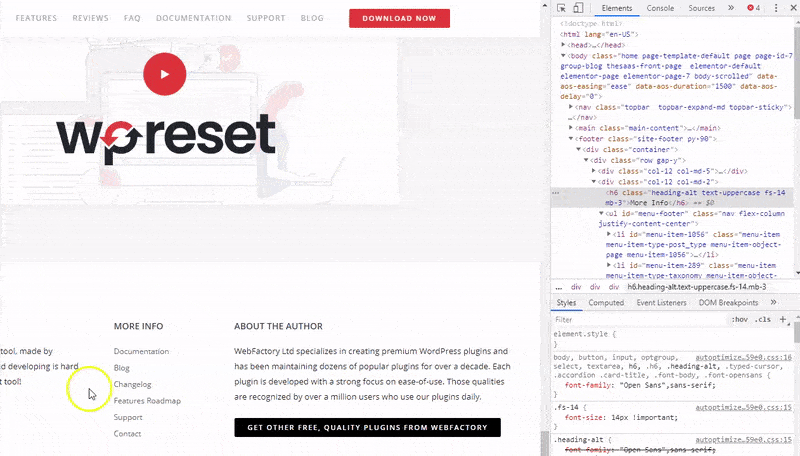
Alternatively, you can access the Chrome console by right-clicking on any element on a website and selecting the Inspect Element option.
The Chrome console panel would appear by the side or bottom of the browser window if you use any of the methods mentioned above. You can unlock the chrome console panel into a separate window or change the dock position by clicking on the Customize and control Devtools button (the three vertical dots at the top right corner of the DevTools panel) and selecting your preferred position beside the Dock side option.
10 Chrome Console tips every developer should know
1. Simulate mobile devices
One of the most important aspects of website testing is to ascertain how responsive your page designs are and their breaking points with respect to different devices. You can use the chrome DevTools to test media queries or find out the resolution at which a website would break so you can set where to apply a media query by simulating different mobile devices.
To access the Chrome console device mode, where you can simulate different mobile devices, click on the toggle device toolbar (the small phone and tablet icon) at the top left corner of the Chrome console panel. This would change the website window to the responsive mode.
Keyboard shortcut: Ctrl + Shift + M (Cmd + Shift + M).
A set of tools that would appear in the website window would allow you to choose the devices and resolution you want to simulate and as well as add mobile devices not available on the list.
2. Inspect network activity
Using the Chrome console, you can inspect the network activity of a website to ensure that all resources are being downloaded and uploaded accurately. And also to inspect the properties of each resource, such as image size, content, HTTP headers, etc.
Click the network tab on the DevTools window. This will open the network panel with an empty log because the tool only logs network activity while it’s open. Press Ctrl + R (Cmd +R) or reload the website to view your page network log activity.
You should see a table down the page showing a chronological log of your page’s network activity. To view more information about each resource, click on the network settings (the gear icon on the right) and check the box next to use large icon request rows.
You can improve the page’s load performance by debugging errors in the network logs to resolve issues like file compression.
3. Network throttling
Similar to mobile device simulation, you can use the Chrome console to simulate different internet speeds. This feature can be useful if you want to test website performance at a specific speed, for instance, on a 3G mobile device.
At the Network panel menu bar, click on online (throttling) and select the internet speed of your choice. To add a custom network profile, click on the add option in the dropdown menu and enter your preferred upload and download speed.
4. Add Script snippet
You can add your favorite random code anywhere you want inside your website using the snippets feature. Instead of having to write the same code over and over again, this feature will allow you to save a snippet and access the code anytime you want.
Click on the sources tab >> snippets >> new snippets. This will create a new file in the snippets pane. Rename your snippet and write your little block of JavaScript code inside the window next to the pane. To save the snippet, right-click on the snippet file, click on save as and choose your preferred directory. You can also access this feature through the command menu.
Use Ctrl + Shift + P or Cmd + Shift + P (Mac) to open the command menu, type snippets and click on create new snippets.
Use Ctrl + Enter or Cmd + Enter to run the code or click on the Run Snippet icon below the text window.
5. Take screenshots of a website
Chrome DevTools allows you to take screenshots of different parts of a website. Open the command menu using Ctrl + Shift + P or Cmd + Shift + P (Mac) and type screenshot. Select the type of screenshot you want. DevTool will automatically screenshot and download the image as .png file into your default downloads directory.
6. Turn on content text editing mode
You can edit your page content directly in the browser window using the Chrome console. Click on the console tab and turn on the feature using the following code.
document.body.contentEditable = ‘true’;
Or
document.designMode=’on’;
Hit the enter key to turn on the feature.
7. Color picker
It’s easier to manipulate color on your website using the color picker which has a range of tools. The eyedropper lets you pick colors from web pages directly and set them on your color properties. You can adjust the hue and opacity of your colors using the color picker and as well as convert between RGBA, HEX, and HSLA with simple clicks.
To access the color picker, select the element you want to change their color. This should open the element tab and stylesheet pane by the right. Find the element CSS property and click the appropriate color box to open the color picker.
8. Edit CSS property
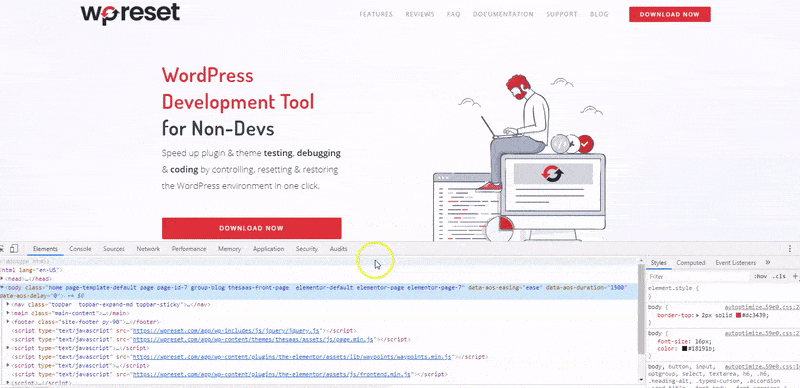
Chrome console offers easy access to adjust the CSS property of any element on a website. Click on the select button (Ctrl + Shift + C or Cmd + Options + C), hover your cursor on the element you wish to edit for an overview of the element properties, click on the element.
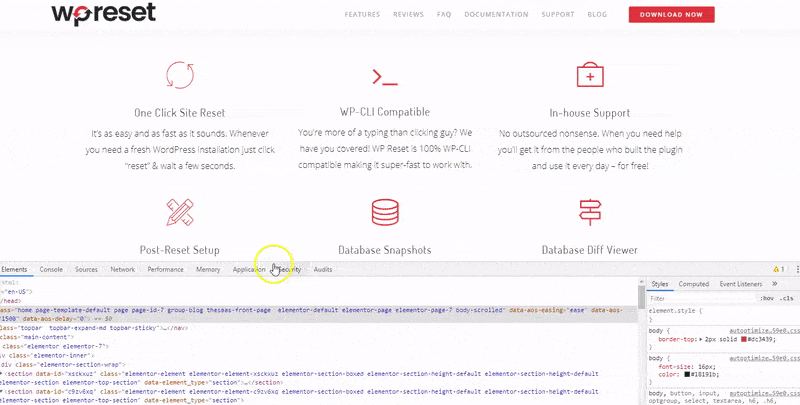
This should highlight the HTML root of the element under the Element pane and the CSS properties at the right-hand side of the DevTools panel. Go to the Styles pane and scroll to the properties you want to edit for real-time changes. You can view full properties of any styling by Ctrl + clicking (Cmd + click) on the property.
9. JavaScript breaking point
It’s largely easier to find and fix JavaScript errors using the breakpoints than the console.log () method. This is because, in the latter method, you need to manually access the source code and insert the console.log() statements into the relevant code before reloading the page to review the logs. Breakpoints don’t necessarily require you to understand the code structure before you can pause on the relevant code.
Click on the Source tab > page and select the script you want to debug from the specific folder. You can set breakpoints in Chrome DevTools by just clicking on the line number you want to pause the script to pause as soon as it executes to that line.
Alternatively, you can use the event listener in the debugger pane to set breaking point with reference to the specific event you’re targeting in the script such as mouse click or media play. Refresh the page using Ctrl + R (Cmd + R) and use the debugger pane tools to move the steps.
10. Store HTML element as global JS variable
Whether you’re inspecting a complex object logged to the console or a DOM element on a site, you can automatically store a reference to them globally. This is very convenient when debugging since you can simply inspect them as a global variable.
Right-click on the object in the console or an element’s HTML block in the Element tab and select “store as global variable” in the drop-down menu. Chrome console will automatically store the element as a global variable and make it available in the console. The variable name will be “tempN”, where N represents the number of times you have stored variables using this method. The first variable will obviously be named “temp1” and second “temp2”.
Conclusion
Proficiency and speed are attributes of ones’ familiarity with their tools, and this goes down deep with the Chrome DevTools. The more information you have, the better and faster you’re likely to use the tools which would, in turn, decrease the time spent debugging.
It could worth more to credit a little percentage of your time this week and next to read through the documentation, beginning with the debugging aspects that often take you the most time. We won’t be surprised if the above-mentioned chrome console tips failed to mention your favorite feature. Please let us know about them in the comment below.
Thanks for that great article. Chrome console is pretty much powerful as i see from this article. By the way, is there a chance u tell me how you creating that beautiful gifs for explaining stuffs? I really want to use this feature in my blog too!
Hi ??
We use Camtasia, but you can use something more simple and free like Screencast O Matic.